
Annual
performance

Investment environment in 2025–26
The world is fundamentally different to what it was just five years ago. The past year brought further global fragmentation, an oil shock driven by conflict in the Middle East, persistent inflation and rapid investment in and expansion of artificial intelligence.
The Middle East conflict is just one of five significant negative supply shocks this decade, with the other four being the implications from the COVID-19 pandemic, the Russian-Ukraine war and the more recent changes to US tariffs and US immigration policies.
The shifting sands of geopolitics continues to make for fertile ground for an array of further shocks. These forces reward portfolios built to be resilient, diversified and flexible.
Portfolio Resilience and the New Investment Order
Our position paper, Portfolio Resilience: Part One, models how we are building a portfolio able to meet its objectives across a wide range of possible scenarios. These scenarios reflect the work we began in 2021 with A New Investment Order, which identified paradigm shifts across the world, economic, policy and market orders. Many of the risks we identified then, are rapidly materialising now.
Across 2025–26, the global system fragmented further towards an unbalanced, multipolar world, with elements consistent with some of the more adverse secular scenarios we model. We continue to believe that forward-looking returns will be harder to earn in this environment, and the right response is to keep building portfolio resilience.
Geopolitics shapes investor outcomes
Geopolitics, which we define more broadly than conflict, remained a key force shaping investor outcomes, as set out in our position paper from 2024, Geopolitics: The Bedrock of the New Investment Order.
Conflict in the Middle East and the closure of the Strait of Hormuz showed how regional powers can constrain global outcomes by controlling critical choke points and resources, with direct consequences for, among other things, energy prices and inflation. We expect these developments will accelerate the resilience-building efforts that were already underway, as countries reprioritise unilateral security, critical commodity supply and domestic industrial capacity, particularly for strategically sensitive sectors.
The episode also demonstrated how control of a choke point can provide significant leverage and how difficult it can be to reverse, potentially making other countries more willing to exploit similar positions of their own.
In response to this more contested geopolitical backdrop, defence spending rose across the world alongside renewed debate over the role of long-standing security alliances. In many parts of the world, populist and right-leaning politics gained ground beyond their traditional bases.
These developments affirm our view that geopolitics is a long-term, structural force rather than a transitory one.
Policy and macroeconomic settings
Policy and macroeconomic settings shifted further in line with geopolitical change. Globally, energy, critical minerals and supply chains are increasingly viewed through a national security lens, raising the importance of access, proximity and control. Economic policy continued to move from efficiency towards resilience, with re-industrialisation, combined with a preference to direct capital flows domestically, gathering pace across the United States, Europe, Japan and Asia.
United States policy also became more interventionist at the margin and remained a source of market volatility through tariffs, trade negotiation and regulatory uncertainty.
Fiscal settings remain broadly expansionary, and global public finances face structural challenges. Governments are increasingly trading off the provision of an effective social safety net against higher debt and interest costs, in some cases exacerbating political instability. Worldwide gross public debt is projected to reach 100% of gross domestic product by 2029, reflecting increasing expenditures around national interests, including bolstering infrastructure and defence.
Parts of the world saw persistent inflation keep pressure on interest rates, while in the United States falling inflation slowed. This divergence adds to market volatility but also creates opportunity for skilled active management.
Persistent above-target inflation continues to challenge policymakers, particularly in the presence of continuing energy shocks, and ongoing trade and supply chain disruptions. Increased volatility and frequency of supply shocks translate to further inflationary pressures building in the pipeline, especially when taking into account significant AI capital expenditure being undertaken globally.
Rising deficits, re-industrialisation, defence spending and the energy transition together point to elevated sovereign debt and upward pressure on bond yields. Because bond yields sit at the core of market pricing, we are monitoring this structural force closely.
Artificial intelligence
AI continued its acceleration as a force in innovation, adoption and disruption. It remained central to strategic competition between the United States and China, with the United States focused on cutting-edge compute and China on scale. It is increasingly a force multiplier across economic activity and defence.
The constraints now in focus are physical and social: energy, water and compute; the effects of data centres on local communities; and a governance and regulatory response that is moving more slowly than deployment. Because AI shapes the outlook for growth, inflation and productivity, it is central to our long-term investment strategy and asset allocation, even as its ultimate path remains uncertain.
Global alliances and a multipolar world
The architecture of global alliances continued to shift. The United States is increasingly oriented towards its own hemisphere, raising questions about its longer-term strategic role in the Indo-Pacific and, in turn, about the regional balance between major powers. In Europe, attention has centred on security and the durability of long-standing alliances.
For a long-term investor, this architecture matters, with a more multipolar, less predictable world requiring a deeper assessment of what this now means for trade and capital flows, and where risk sits in our investment portfolio.
Global economic backdrop
Risk markets were broadly supportive across the year, though sentiment shifted sharply in the March quarter as inflation concerns, stemming from the closure of the Strait of Hormuz and the risk of a stagflationary environment, unsettled markets. Our positioning helped to protect the portfolio during that period, with the value of the Future Fund rising across the financial year.
Traditional diversification alone is no longer enough in a fragmented and volatile world. As we explore in Portfolio Resilience: Part One, a resilient portfolio is stress-tested, rebalanced and designed to adapt.
The transition to the New Investment Order is not linear. For a resilient, long-term portfolio, the twists and turns of this transition continue to present opportunity.
Total funds under management
$356bn
at 30 June 2026
Future Fund
Drought Fund
$289.7bn
Ready Fund
Investment performance
Future Fund
The Future Fund was established in April 2006 to strengthen the long-term financial position of the Commonwealth of Australia.
Investment mandate
CPI + 4.0%–5.0% per annum
To achieve an average annual return of at least the Consumer Price Index (CPI) + 4.0%–5.0% per annum over the long term, with an acceptable but not excessive level of risk.
Investment performance
14.8%
pa return in 2025–26
8.0%
pa target return in 2025–26
9.0%
pa 10-year return
7.1%
pa target 10-year return
$289.7bn
value at 30 June 2026
Note(s):
- From 1 July 2017, the Fund’s Investment Mandate target return was reduced from CPI + 4.5% to 5.5% pa to CPI + 4.0% to 5.0% pa over the long term, with an acceptable but not excessive level of risk.
- Industry measure showing the level of realised volatility in the portfolio.
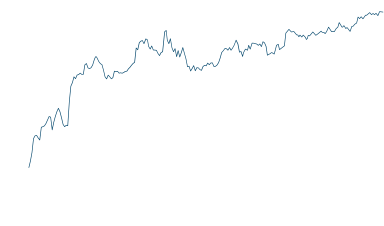
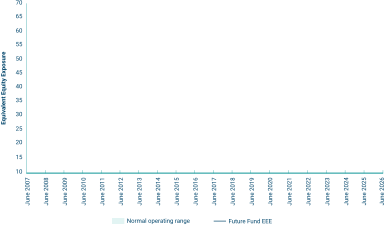
Future Fund Equivalent Equity Exposure (EEE) since inception

Measuring risk
One of the primary metrics we use to understand and manage the broad market risk exposure of the Future Fund is Equivalent Equity Exposure (EEE). EEE estimates the amount of market exposure we have when looking through the whole portfolio.
The chart above demonstrates how the EEE of the Future Fund has changed over time.
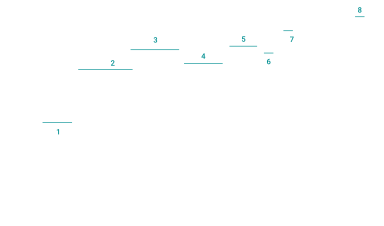
We are currently in the eighth distinct risk-taking regime for the portfolio since establishment.
- The build of the Future Fund portfolio was suspended in late 2007 due to concerns over financial stability and the sustainability of high asset prices, and a very low-risk profile was maintained into the Global Financial Crisis.
- Portfolio risk exposure was increased as extraordinary and globally coordinated economic policies were implemented to fight the crisis.
- Risk levels were raised further as the European crisis subsided and the President of the European Central Bank committed to “do whatever it takes” to underwrite the integrity of the euro.
- As expected returns declined (given strong market performance supported by low interest rates), portfolio risk was gradually reduced to moderately below normal levels.
- Risk levels were increased towards more normal levels, reflecting the emergence of strong economic growth and corporate earnings, and central banks signalling an extension of accommodative monetary policies, together with the decision to increase the Future Fund’s structural risk appetite.
- Risk levels were reduced to moderately below neutral, reflecting the elevated risk environment resulting from the COVID-19 pandemic and policy response.
- The structural risk level was adjusted during the 2020–21 financial year and we narrowed the range around which we expect to manage the portfolio. Subsequently, EEE was managed reasonably close to neutral structural levels.
- The structural risk level was increased in 2024–25 to increase the probability of achieving the Investment Mandate return target in the long term. The decision was implemented progressively throughout the year.
Risk positioning
The EEE range within which we are expected to operate most of the time was reviewed and uplifted in 2024–25 to 60–70, in line with an increase in structural risk appetite for EEE. This change was made by the Board to increase the likelihood of achieving its Investment Mandate’s benchmark return target over the long term.
At 30 June 2026, the EEE stood at 65.4, which is in the middle of the range.
Medical Research Future Fund
The Medical Research Future Fund (MRFF) was established in August 2015 to improve the health and wellbeing of Australians by providing grants of financial assistance to support medical research and medical innovation.
Investment mandate
RBA + 1.5%–2.0% per annum
To achieve at least the Reserve Bank of Australia (RBA) cash rate target + 1.5%–2.0% per annum, net of investment fees, over a rolling 10-year term.
Investment performance
10.1%
pa return in 2025–26
5.4%
pa target return in 2025–26
5.7%
pa 10-year return
3.6%
pa target 10-year return
$26.3bn
value at 30 June 2026
Note(s):
- RBA cash rate plus 1.5% to 2.0% pa over the long term, with an acceptable but not excessive level of risk.
- Industry measure showing the level of realised volatility in the portfolio.
Risk positioning
Our expected EEE range for the Medical Research Future Fund is
29 to 37.
At 30 June 2026, the EEE stood at 33, which is
the middle of the range.
Aboriginal and Torres Strait Islander Land and Sea Future Fund
The Aboriginal and Torres Strait Islander Land and Sea Future Fund (ATSILS) was established in February 2019 to enhance the Commonwealth’s ability to make payments to the Indigenous Land and Sea Corporation.
Investment mandate
CPI + 2.0%–3.0% per annum
To achieve an average annual return of at least the CPI + 2.0%–3.0% per annum over the long term, with an acceptable but not excessive level of risk.
Investment performance
11.9%
pa return in 2025–26
6.0%
pa target return in 2025–26
$2.7bn
value at 30 June 2026
Note(s):
- CPI + 2.0% to 3.0% pa over the long term, with acceptable but not excessive level of risk.
- Industry measure showing the level of realised volatility in the portfolio.
Risk positioning
Our expected EEE range for the ATSILS Fund is 38 to 48.
At
30 June 2026, the EEE stood at 44, which is the middle of the
range.
Future Drought Fund
The Future Drought Fund (FDF) was established in September 2019 to support initiatives that enhance the drought resilience of Australian farms and communities.
Investment mandate
CPI + 2.0%–3.0% per annum
To achieve an average annual return of at least the CPI + 2.0%–3.0% per annum over the long term, with an acceptable but not excessive level of risk.
Investment performance
11.9%
pa return in 2025–26
6.0%
pa target return in 2025–26
$5.8bn
value at 30 June 2026
Note(s):
- The Investment Mandate for the Future Drought Fund is CPI + 2.0% to 3.0% pa over the long term, with an acceptable but not excessive level of risk.
- Industry measure showing the level of realised volatility in the portfolio.
Risk positioning
Our expected EEE range for the Future Drought Fund is 38 to 48.
At 30 June 2026, the EEE stood at 43, which is the middle
of the range.
Disaster Ready Fund
The Disaster Ready Fund (DRF) was initially established as the Emergency Response Fund in 2019, then renamed on 1 March 2023. It funds natural disaster resilience and risk reduction.
Investment mandate
CPI + 2.0%–3.0% per annum
To achieve an average annual return of at least the CPI + 2.0%–3.0% per annum over the long term, with an acceptable but not excessive level of risk.
Investment performance
11.9%
pa return in 2025–26
6.0%
pa target return in 2025–26
$5.3bn
value at 30 June 2026
Note(s):
- The Investment Mandate for the Disaster Ready Fund is CPI + 2.0% to 3.0% pa over the long term, with an acceptable but not excessive level of risk.
- Industry measure showing the level of realised volatility in the portfolio.
Risk positioning
Our expected EEE range for the Disaster Ready Fund is 38 to 48.
At 30 June 2026, the EEE stood at 43, which is the middle
of the range.
Housing Australia Future Fund
The Housing Australia Future Fund (HAFF) was established in November 2023 to enhance the Commonwealth’s ability to make grants in relation to acute housing needs, social housing or affordable housing.
Investment mandate
CPI + 2.0%–3.0% per annum
To achieve an average annual return of at least the CPI + 2.0%–3.0% per annum over the long term, with an acceptable but not excessive level of risk.
Investment performance
11.6%
pa return in 2025–26
6.0%
pa target return in 2025–26
$11.7bn
value at 30 June 2026
Note(s):
- The Investment Mandate for the Housing Australia Future Fund is CPI +2.0% to 3.0% pa over the long term, with an acceptable but not excessive level of risk.
- Industry measure showing the level of realised volatility on the portfolio.
Risk positioning
Our expected EEE range for the HAFF is 38 to 48.
At 30
June 2026, the EEE stood at 44, which is the middle of the
range.
DisabilityCare Australia Fund
The DisabilityCare Australia Fund (DCAF) was established in July 2014 to help fund the National Disability Insurance Scheme (NDIS), which will support a better life for Australians with a significant or permanent disability and their families and carers.
Investment mandate
BBSW + 0.3% per annum
To achieve a benchmark return of the Australian three-month bank bill swap rate + 0.3% per annum, calculated on a rolling 12-month basis. Investments must minimise the probability of capital loss over a 12-month horizon.
Investment performance
4.4%
pa return in 2025–26
4.2%
pa target return in 2025–26
$14.5bn
value at 30 June 2026
